
IR Menu

Performance & Financial Highlights
Net sales
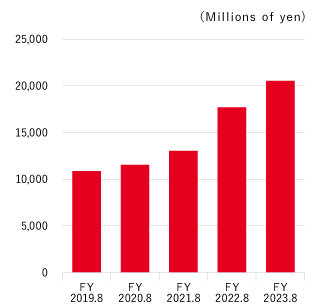
| FY 2019.8 |
FY 2020.8 |
FY 2021.8 |
FY 2022.8 |
FY 2023.8 |
|---|---|---|---|---|
| 10,855 | 11,517 | 13,027 | 17,701 | 20,531 |
Operating profit
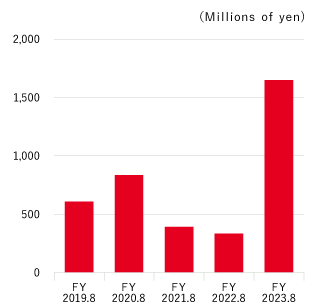
| FY 2019.8 |
FY 2020.8 |
FY 2021.8 |
FY 2022.8 |
FY 2023.8 |
|---|---|---|---|---|
| 608 | 835 | 392 | 334 | 1,649 |
Ordinary profit
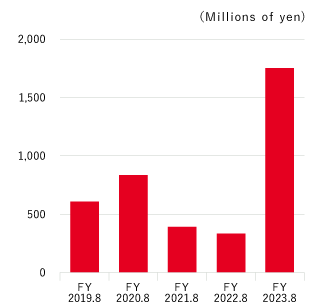
| FY 2019.8 |
FY 2020.8 |
FY 2021.8 |
FY 2022.8 |
FY 2023.8 |
|---|---|---|---|---|
| 654 | 923 | 452 | 439 | 1,751 |
Profit attributable to owners of parent
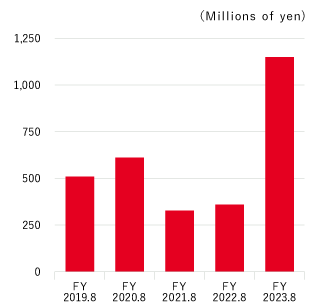
| FY 2019.8 |
FY 2020.8 |
FY 2021.8 |
FY 2022.8 |
FY 2023.8 |
|---|---|---|---|---|
| 510 | 611 | 277 | 269 | 1,150 |
Total assets
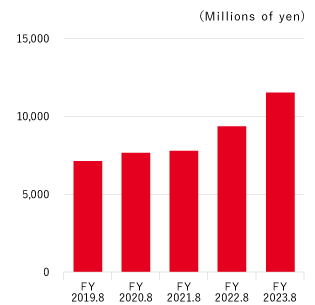
| FY 2019.8 |
FY 2020.8 |
FY 2021.8 |
FY 2022.8 |
FY 2023.8 |
|---|---|---|---|---|
| 7,118 | 7,647 | 7,790 | 9,355 | 11,533 |
Net assets
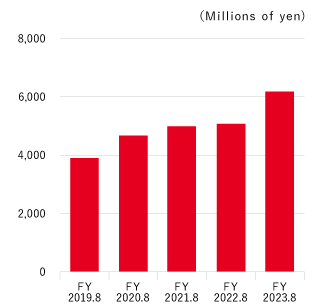
| FY 2019.8 |
FY 2020.8 |
FY 2021.8 |
FY 2022.8 |
FY 2023.8 |
|---|---|---|---|---|
| 3,896 | 4,669 | 4,882 | 5,075 | 6,176 |
Equity ratio
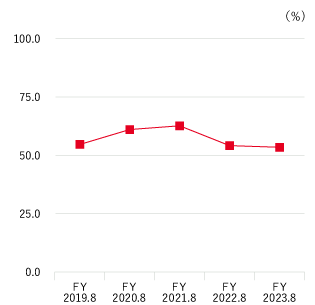
| FY 2019.8 |
FY 2020.8 |
FY 2021.8 |
FY 2022.8 |
FY 2023.8 |
|---|---|---|---|---|
| 54.7 | 61.1 | 62.7 | 54.2 | 53.5 |
Profit attributable to owners of parent / equity

| FY 2019.8 |
FY 2020.8 |
FY 2021.8 |
FY 2022.8 |
FY 2023.8 |
|---|---|---|---|---|
| 16.0 | 14.3 | 5.8 | 5.4 | 20.5 |
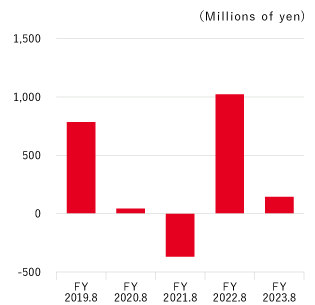
Cash flows from operating activities
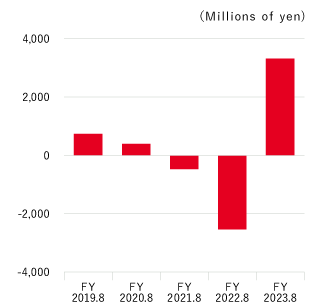
| FY 2019.8 |
FY 2020.8 |
FY 2021.8 |
FY 2022.8 |
FY 2023.8 |
|---|---|---|---|---|
| 741 | 396 | △446 | △2,536 | 3,322 |
Cash flows from investing activities
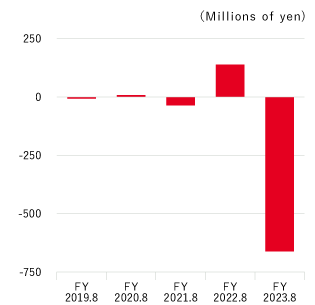
| FY 2019.8 |
FY 2020.8 |
FY 2021.8 |
FY 2022.8 |
FY 2023.8 |
|---|---|---|---|---|
| △7 | 8 | △36 | 138 | △662 |
Cash flows from financing activities
| FY 2019.8 |
FY 2020.8 |
FY 2021.8 |
FY 2022.8 |
FY 2023.8 |
|---|---|---|---|---|
| 784 | 42 | △368 | 1,021 | 143 |
Cash and cash equivalents at end of period
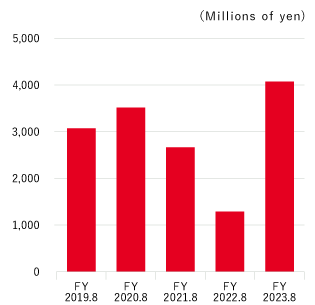
| FY 2019.8 |
FY 2020.8 |
FY 2021.8 |
FY 2022.8 |
FY 2023.8 |
|---|---|---|---|---|
| 3,070 | 3,516 | 2,665 | 1,289 | 4,092 |